Cyfe
Visualize your KPIS with an all-in-one business dashboard.

About

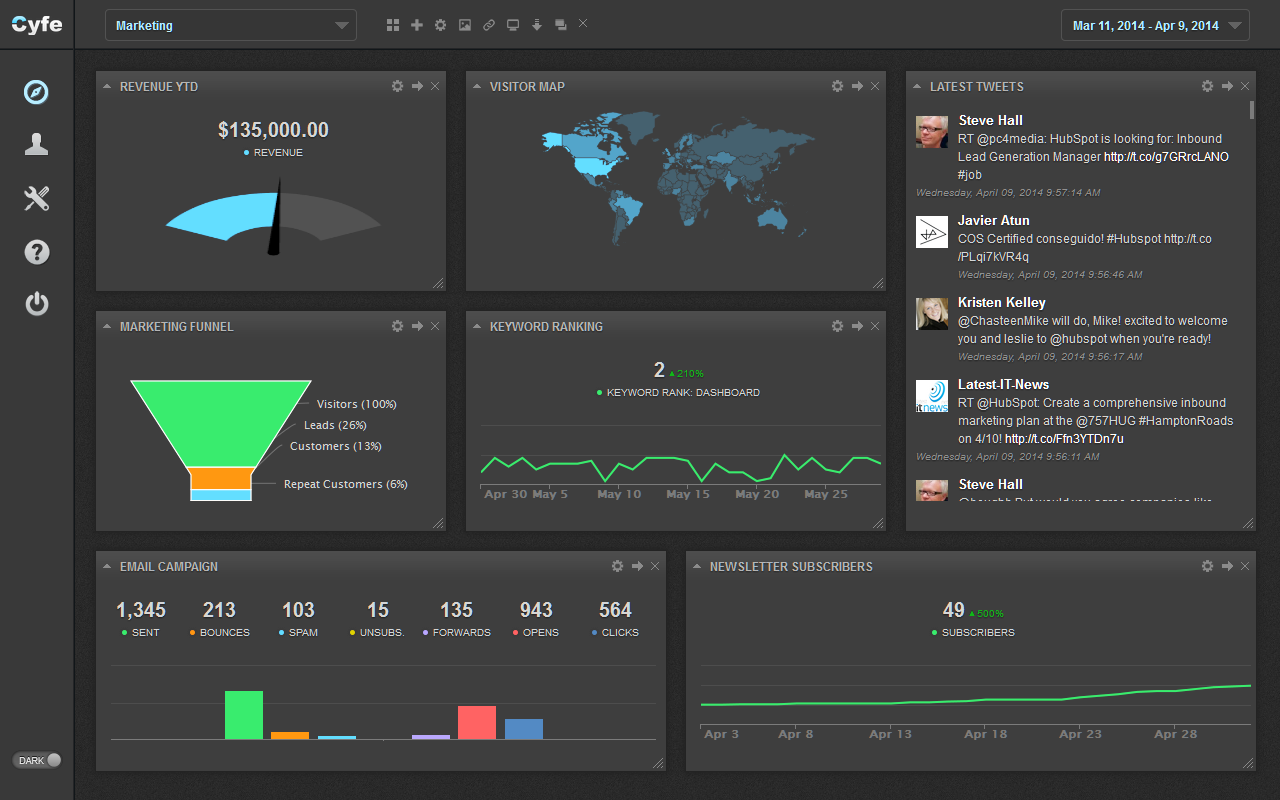
Cyfe is a data visualization and dashboard reporting solution. It’s easy to use, fully customizable and offers unlimited integrations with over 50 popular services and custom data sources at an affordable price.

From social media to SEO, and marketing to finance – it’s easy to bring your data together into a single view in less than 5 minutes. No code. No APIs. Display, export, or automate reports to tell the story of your data clearly.

Features

- Pre-built Dashboard Templates: Find the perfect online dashboard template, connect your data, and start monitoring your KPIs. Modify the template to meet your business needs.

- Automated Reports & Widget Alerts: Download or schedule automatic email reports of your data in PNG, JPEG, PDF, and CSV formats. Monitor metrics even when you’re away from your dashboards with alerts via email or SMS.

- Embedded Analytics: Cyfe allows you the flexibility to share your data securely on your terms with even more white label options and with in-depth customization.

- Custom Data Dashboards: Blend your own collected data via simple spreadsheets, data sources from the expansive 1500+ app ecosystem of Zapier, or your own custom SQL databases.

Pricing

Media / Screenshots

Category

Tags

Social

Acquired by

{{ reviewsTotal }}{{ options.labels.singularReviewCountLabel }}
{{ reviewsTotal }}{{ options.labels.pluralReviewCountLabel }}
{{ options.labels.newReviewButton }}
{{ userData.canReview.message }}

Similar Tools

LAST UPDATE:
Predictive Analytics, Simplified
|
LAST UPDATE:
Investor updates made easy.
LAST UPDATE:
AI-powered image enhancement tools.
LAST UPDATE:
A versatile end-to-end ETL solution that helps businesses put their data to work.
LAST UPDATE:
Interactive business intelligence dashboards.
LAST UPDATE:
Infuse analytics into your workstreams or products.
Facebook
Twitter
LinkedIn

We keep adding tools, ebooks, articles, resources...

get up & get in